Golden Years infographic explores the facts of life for the 1.5 million Americans that live full time in a nursing facility.
GOLDEN YEARS?
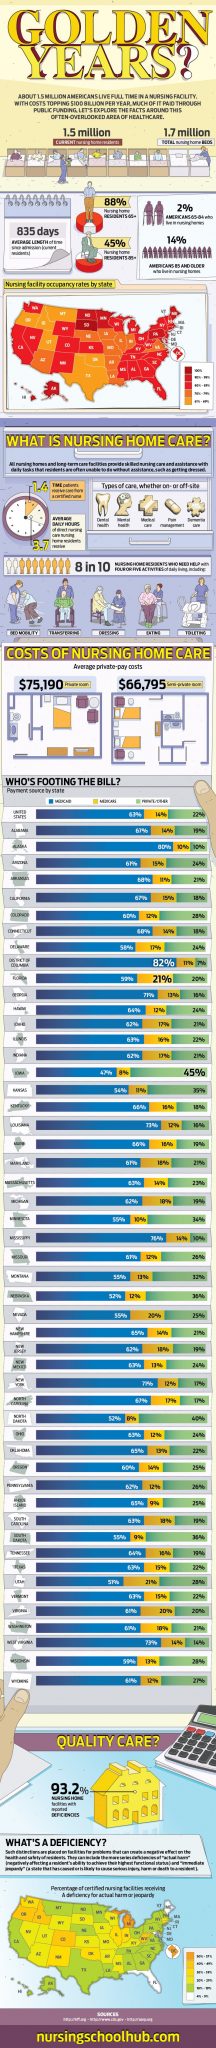
About 1.5 million Americans live full-time in a nursing facility. With costs topping $100 billion per year, much of it paid through public funding, let’s explore the facts around this often-overlooked area of healthcare.
Who Lives in Nursing Homes?
Featured Programs
1.5 million – Current nursing home residents
1.7 million – Total nursing home beds
835 days – Average length of time since admission (current residents)
88% – Nursing home residents 65+
45% – Nursing home residents 85%
2% – Americans 65-84 who live in nursing homes
14% – Americans 85 and older who live in nursing homes
Alabama 85.4%
Alaska 91.3%
Arizona 70.4%
Arkansas 72.8%
California 84.9%
Colorado 80.5%
Connecticut 88.7%
Delaware 86.1%
District of Columbia 93.4%
Florida 87.6%
Georgia 85.3%
Hawaii 91.4%
Idaho 69.8%
Illinois 78.5%
Indiana 78.5%
Iowa 79.7%
Kansas 82.7%
Kentucky 89.6%
Louisiana 72.5%
Maine 91.0%
Maryland 87.6%
Massachusetts 88.3%
Michigan 85.0%
Minnesota 90.6%
Mississippi 88.2%
Missouri 71.8%
Montana 69.5%
Nebraska 78.3%
Nevada 81.6%
New Hampshire 89.7%
New Jersey 87.9%
New Mexico 82.7%
New York 91.8%
North Carolina 86.2%
North Dakota 90.3%
Ohio 85.3%
Oklahoma 67.3%
Oregon 61.4%
Pennsylvania 90.4%
Rhode Island 92.2%
South Carolina 89.5%
South Dakota 100.0%
Tennessee 84.9%
Texas 69.9%
Utah 66.3%
Vermont 87.6%
Virginia 88.2%
Washington 80.4%
West Virginia 88.1%
Wisconsin 83.1%
Wyoming 81.6%
What is Nursing Home Care?
All nursing homes and long-term care facilities provide skilled nursing care and assistance with daily tasks that residents are often unable to do without assistance, such as getting dressed.
3.7 – Average daily hours of direct nursing care nursing home residents receive
1.4 hours – Time patients receive care from a certified nurse
Types of care, whether on- or off-site
- Dental health
- Mental health
- Medical care
- Pain management
- Dementia care
Eight in 10 Nursing home residents who need help with four or five activities of daily living, including bed mobility, transferring, dressing, eating and toileting
Costs of Nursing Home Care
Average private-pay costs
Private room $75,190
Semi-private room $66,795
Who’s Footing the Bill?
Payment source by state
State Medicaid Medicare Private/Other
United States 63% 14% 22%
Alabama 67% 14% 19%
Alaska 80% 10% 10%
Arizona 61% 15% 24%
Arkansas 68% 11% 21%
California 67% 15% 18%
Colorado 60% 12% 28%
Connecticut 68% 14% 18%
Delaware 58% 17% 24%
District of Columbia 82% 11% 7%
Florida 59% 21% 20%
Georgia 71% 13% 16%
Hawaii 64% 12% 24%
Idaho 62% 17% 21%
Illinois 63% 16% 22%
Indiana 62% 17% 21%
Iowa 47% 8% 45%
Kansas 54% 11% 35%
Kentucky 66% 16% 18%
Louisiana 73% 12% 16%
Maine 66% 16% 19%
Maryland 61% 18% 21%
Massachusetts 63% 14% 23%
Michigan 62% 18% 19%
Minnesota 55% 10% 34%
Mississippi 76% 14% 10%
Missouri 61% 12% 26%
Montana 55% 13% 32%
Nebraska 52% 12% 36%
Nevada 55% 20% 25%
New Hampshire 65% 14% 21%
New Jersey 62% 18% 19%
New Mexico 63% 13% 24%
New York 71% 12% 17%
North Carolina 67% 17% 17%
North Dakota 52% 8% 40%
Ohio 63% 12% 24%
Oklahoma 65% 13% 22%
Oregon 60% 14% 25%
Pennsylvania 62% 12% 26%
Rhode Island 65% 9% 25%
South Carolina 63% 18% 19%
South Dakota 55% 9% 36%
Tennessee 64% 16% 19%
Texas 63% 15% 22%
Utah 51% 21% 28%
Vermont 63% 15% 22%
Virginia 61% 20% 20%
Washington 61% 18% 21%
West Virginia 73% 14% 14%
Wisconsin 59% 13% 28%
Wyoming 61% 12% 27%
Quality Care?
93.2% – Nursing home facilities with reported deficiencies
What’s a Deficiency?
Such distinctions are placed on facilities for problems that can create a negative effect on the health and safety of residents. They can include the more series deficiencies of “actual harm” (negatively affecting a resident’s ability to achieve their highest functional status) and “immediate jeopardy” (a state that has caused or is likely to cause serious injury, harm, or death to a resident).
Nursing Facilities
Percentage of certified nursing facilities receiving a deficiency for actual harm or jeopardy
United States 21.9%
Alabama 11.8%
Alaska 18.8%
Arizona 23.1%
Arkansas 27.5%
California 10.0%
Colorado 40.4%
Connecticut 39.2%
Delaware 39.1%
District of Columbia 57.9%
Florida 9.4%
Georgia 11.0%
Hawaii 15.8%
Idaho 45.6%
Illinois 35.9%
Indiana 31.1%
Iowa 28.0%
Kansas 29.7%
Kentucky 20.4%
Louisiana 19.2%
Maine 4.7%
Maryland 9.8%
Massachusetts 23.8%
Michigan 57.9%
Minnesota 17.9%
Mississippi 26.1%
Missouri 27.0%
Montana 11.9%
Nebraska 14.8%
Nevada 25.5%
New Hampshire 16.9%
New Jersey 15.2%
New Mexico 33.8%
New York 13.6%
North Carolina 16.2%
North Dakota 17.9%
Ohio 15.5%
Oklahoma 34.7%
Oregon 46.5%
Pennsylvania 15.5%
Rhode Island 5.9%
South Carolina 18.6%
South Dakota 23.4%
Tennessee 18.9%
Texas 17.3%
Utah 29.9%
Vermont 15.0%
Virginia 19.2%
Washington 39.8%
West Virginia 40.7%
Wisconsin 27.4%
Wyoming 21.1%
Related: