Nursing an Aging America infographic discusses if there will be enough nurses to take care of all the aging patients? And what about the aging nurses?
Nursing in an Aging America
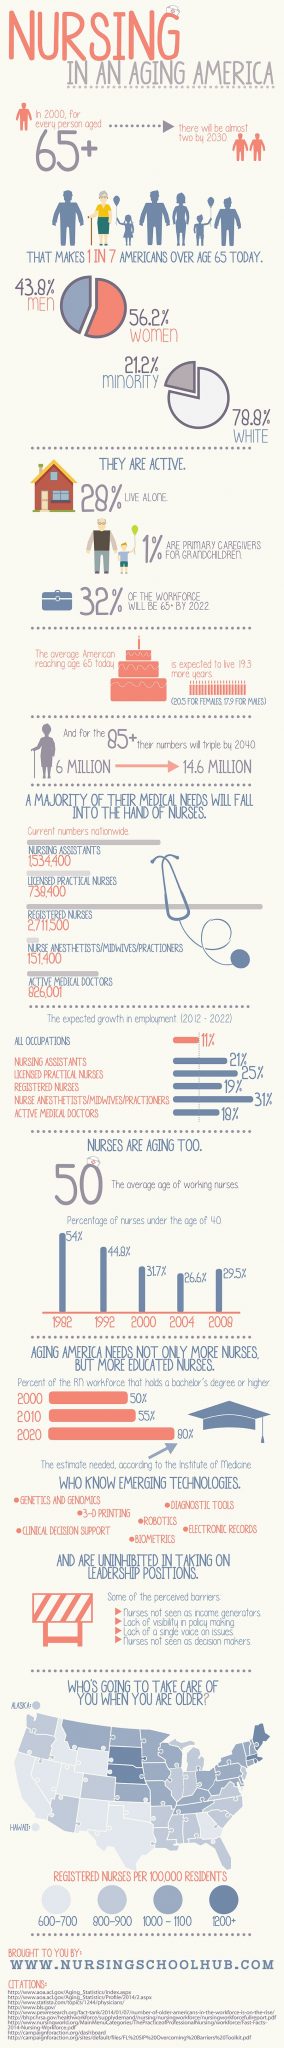
For every person aged 65+ in 2000, there will be almost two by 2030. That makes one in seven Americans today over the age of 65.
Profile:
- 25.1 million are women (56.2%)
- 19.6 million are men (43.8%)
- 78.8% are white
- 21.2% are minority
And they’re active:
- 28% of older Americans live alone
- 536,000 grandparents 65+ have primary responsibility for their grandchildren
- (slightly more than 1 in 100 if you want to plot that way)
- By 2022 31.9% of the workforce will be ages 65-75
And America’s just getting older
Featured Programs
The average American reaching 65 today is expected to live 19.3 years
20.5 for females
17.9 for males
With the population of 85+ expected to nearly triple from 2013-2040
2013: 6 million
2040: 14.6 million
A majority of their medical needs will fall into the hands of nurses.
Number nationwide:
Nursing Assistants: 1,534,400
Licensed Practical Nurses: 738,400
Registered Nurses: 2,711,500
Nurse Anesthetists/midwives/practitioners: 151,400
Active MD’s: 826,001
Can they keep pace?
Increase in percentage 2012-2022:
Americans 75+: 25%
Americans 85+: 50%
Expected change in employment:
Average Growth in All Occupations: 11%
Nursing Assistants: 21%
Licensed Practical Nurses: 25%
Registered Nurse: 19%
Nurse Anesthetists/midwives/practitioners: 31%
MD’s: 18%
Actual Growth Rate Today:
Licensed Practical Nurses: 15.5%
Registered Nurses: 24.1%
The Bad News
Nurses are aging too:
Average age of working nurses: 50
RNs expected to retire/leave the workforce by 2022: 555,100 (one in five)
Percentage of nurses under 40:
1980: 54%
1992: 44.8%
2000:31.7%
2004:26.6%
2008:29.5%
Aging America needs not only more nurses, but more educated nurses.
2000 – 50% of the RN workforce hold a bachelor’s degree or higher
2010 – 55% of the RN workforce hold a bachelor’s degree or higher
2020 – The Institute of Medicine states we need 80% of the RN workforce to hold bachelor’s degrees or higher
Who knows how to use more technology
- Genetics and Genomics
- Less Invasive and More Accurate Diagnostic Tools
- 3-D Printing
- Robotics
- Biometrics
- Electronic Healthcare Records
- Clinical Decision Support
- And are uninhibited in taking on leadership positions
Largest perceived barriers to attaining nursing leadership:
percentage of nurses seeing the following as a major barrier
- Nurses, as compared to physicians, are not seen as revenue generators: 75.97%
- Lack of visibility of nurses in policy making: 70.43%
- Lack of a single voice among nurses in speaking on state issues: 68.06%
- Public perception of nurses’ roles, as compared to physicians, as important health care decision-makers: 67.6%
Who’s going to take care of you when you’re old?
List of the current Registered Nurses per 100,000 residents.
Alabama: 960.6
Alaska: 800.6
Arizona: 801.2
Arkansas: 946.1
California: 743.1
Colorado: 874.8
Connecticut: 1,054.5
Delaware: 1,163.9
District of Columbia: 1,666.2
Florida: 896.8
Georgia: 790.4
Hawaii: 694.4
Idaho: 677.7
Illinois: 939.4
Indiana: 985.6
Iowa: 1,100.4
Kansas: 1,007.9
Kentucky: 1,036.5
Louisiana: 954.4
Maine: 1,215.2
Maryland: 975.7
Massachusetts: 1,239.1
Michigan: 902.7
Minnesota: 1,091.7
Mississippi: 908.6
Missouri: 1,069.7
Montana: 1,135.6
Nebraska: 1,227.7
Nevada: 724.7
New Hampshire: 1,053
New Jersey: 859.6
New Mexico: 770.5
new York: 1,016.3
North Carolina: 960.4
North Dakota: 1,157
Ohio: 1,098.2
Oklahoma: 790.2
Oregon: 843.9
Pennsylvania: 1,106.2
Rhode Island: 1,209.3
South Carolina: 921.6
South Dakota: 1,247.7
Tennessee: 1,065.4
Texas: 752.6
Utah: 689.9
Vermont: 1,044.5
Virginia: 810.6
Washington: 850.2
West Virginia: 1,040.4
Wisconsin: 1,073.1
Wyoming: 771.6
US Average: 920.9
Related: